|
|
Here are some statistics from the 2013 season that you might find interesting: - We had 105 different anglers fish at least one tournament in 2013.
- We had 14 anglers fish every regular season tournament in 2013.
- The most fish weighed-in in one evening was 37 on June 25.
- We had 11 evenings where 20 or more fish were weighed-in.
- The most weight brought to the scales in one evening was 104.29 lbs on June 25.
- We had 12 evenings break 50 lbs of total weight.
- The most fish weighed-in in one evening for a team was 7 by Miles Johnson and Mike Toht on July 2 and July 30.
- The most weight brought to the scales in one evening for a team was 20.28 lbs, by Miles Johnson and Mike Toht on July 2.
- The largest bass weighed-in this year was 6.89 lbs, by Mike Toht and Brad Wall on September 29.
- 471 total fish were weighed-in through the 24 regular season tournaments and the championship in 2013.
- 1278 lbs of bass crossed the scales in 2013.
- The average number of bass weighed-in per tournament in 2013 was 18.8.
- The average weight brought in per tournament in 2013 was 51.12 lbs.
- The average bass weighed-in this year was 2.71 lbs.
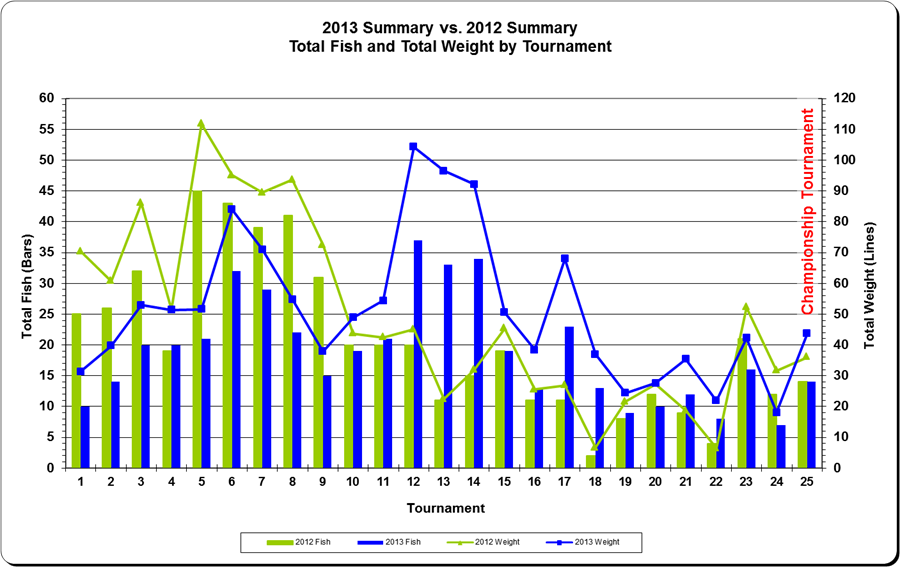
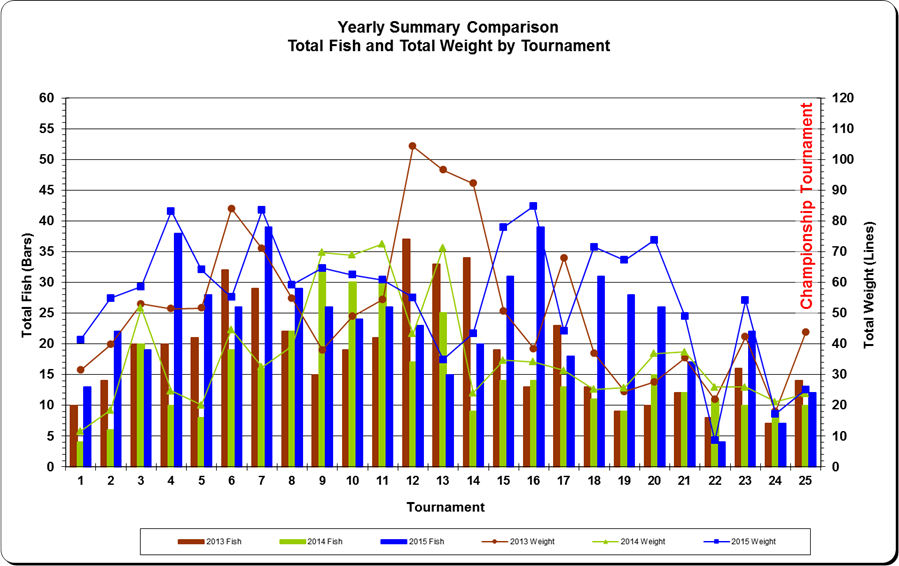
The 2013 season was equally as impressive as the 2012 season with the quality of bass improving quite a bit! On average, 19 fish were weighed-in at each tournament this year as compared to 20 fish last year. We had 11 tournaments this year with 20+ bass weighed-in as compared to 12 times last year. We had 15 tournaments this year with 40+ lbs of fish weighed-in as compared to 14 last year. And in one of those tournaments we had over 100 lbs of fish weighed-in.
Below is a graph showing the total number of fish weighed-in and the total weight for each tournament in 2013. The total number of fish weighed-in is plotted as the blue bars and relate to the scale on the left. The total weight is plotted as the blue line and relates to the scale on the right.
|
|
|
Here are some statistics from the 2012 season that you might find interesting: - We had 120 different anglers fish at least one tournament in 2012.
- We had 19 anglers fish every regular season tournament in 2012.
- The most fish weighed-in in one evening was 45 on May 8.
- We had 12 evenings where 20 or more fish were weighed-in.
- The most weight brought to the scales in one evening was 111.73 lbs on May 8.
- We had 10 evenings break 50 lbs of total weight.
- The most fish weighed-in in one evening for a team was 7 by Kevin Henry and Ryan Hipsher on May 15.
- The most weight brought to the scales in one evening for a team was 15.58 lbs, by Jerry Back and Tim Keever on April 10.
- The largest bass weighed-in this year was 6.35 lbs, by Jerry Back and Tim Keever on April 10.
- 510 total fish were weighed-in through the 24 regular season tournaments and the championship in 2012.
- 1214 lbs of bass crossed the scales in 2012.
- The average number of bass weighed-in per tournament in 2012 was 20.4.
- The average weight brought in per tournament in 2012 was 48.59 lbs.
- The average bass weighed-in this year was 2.38 lbs.
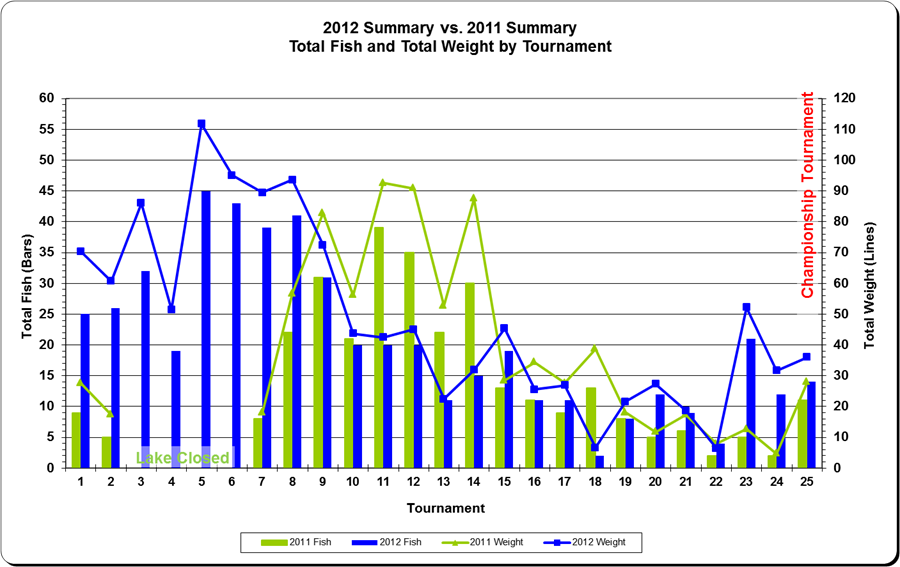
The 2012 season was more impressive than the 2011 season! On average, 20 fish were weighed-in at each tournament this year as compared to 15 fish last year. We had 12 tournaments this year with 20+ bass weighed-in as compared to 7 times last year. We had 14 tournaments this year with 40+ lbs of fish weighed-in as compared to 7 last year. And in one of those tournaments we had over 110 lbs of fish weighed-in.
Below is a graph showing the total number of fish weighed-in and the total weight for each tournament in 2012. The total number of fish weighed-in is plotted as the blue bars and relate to the scale on the left. The total weight is plotted as the blue line and relates to the scale on the right.
|
|
Last Updated on Thursday, 11 April 2013 18:21 |
|
Here are some statistics from the 2011 season that you might find interesting:
- We had 89 different anglers fish at least one tournament in 2011.
- We had 12 anglers fish every regular season tournament in 2011.
- The most fish weighed-in in one evening was 39 on June 21.
- We had 7 evenings where 20 or more fish were weighed-in.
- The most weight brought to the scales in one evening was 92.56 lbs on June 21.
- We had 7 evenings break 50 lbs of total weight.
- The most fish weighed-in in one evening for a team was 6 and it was done 2 times in 2011.
- The most weight brought to the scales in one evening for a team was 15.70 lbs, by Kevin Hipsher and Ryan Hipsher on June 28.
- The largest bass weighed-in this year was 6.20 lbs, by Kevin Henry and Ryan Hipsher on August 30.
- 307 total fish were weighed-in through the 24 regular season tournaments and the championship in 2011.
- 812 lbs of bass crossed the scales in 2011.
- The average number of bass weighed-in per tournament in 2011 was 14.6.
- The average weight brought in per tournament in 2011 was 38.64 lbs.
- The average bass weighed-in this year was 2.64 lbs.
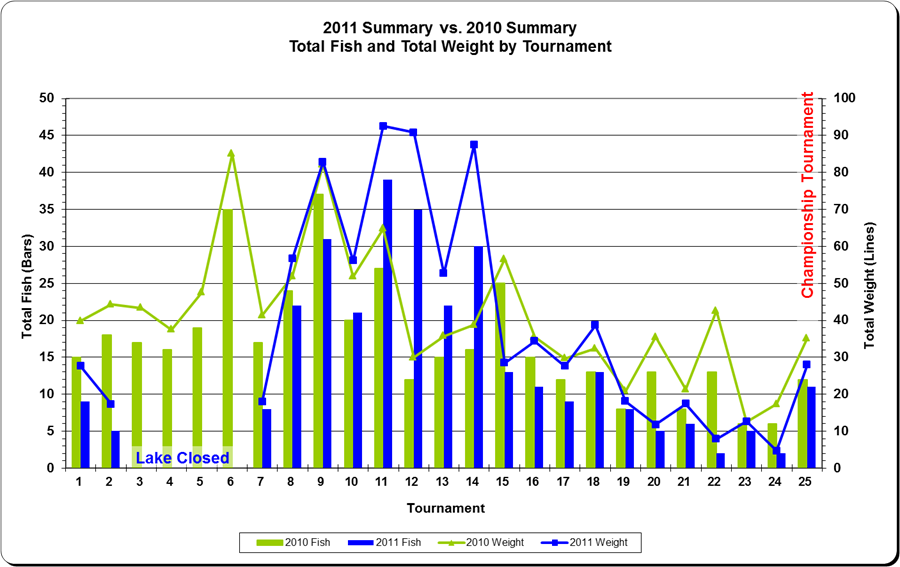
The 2011 season was equally as impressive as the 2010 season! On average, 15 fish were weighed-in at each tournament this year as compared to 17 fish last year. We had 7 tournaments this year with 20+ bass weighed-in as compared to 6 times last year. We had 7 tournaments this year with 40+ lbs of fish weighed-in as compared to 11 last year. And in 2 of those tournaments we had over 90 lbs of fish weighed-in. We had 12 big fish weighed-in at over 5 lbs as compared to 2 last year. Had the lake not been flooded and closed for four weeks, the total number of bass caught and total weight would have been very close to last year's totals.
Below is a graph showing the total number of fish weighed-in and the total weight for each tournament in 2011. The total number of fish weighed-in is plotted as the blue bars and relate to the scale on the left. The total weight is plotted as the blue line and relates to the scale on the right.
|
|
Last Updated on Wednesday, 04 July 2012 12:39 |
|
|
Here are some statistics from the 2010 season that you might find interesting:
- We had 109 different anglers fish at least one tournament in 2010.
- We had 14 anglers fish every regular season tournament in 2010.
- The most fish weighed-in in one evening was 37 on June 8.
- We had 6 evenings where 20 or more fish were weighed-in.
- The most weight brought to the scales in one evening was 85.03 lbs on May 18.
- We had 6 evenings break 50 lbs of total weight.
- The most fish weighed-in in one evening for a team was 4 and it was done 6 times in 2010.
- The most weight brought to the scales in one evening for a team was 11.82 lbs, by Rod Hipsher and Ed Reynolds on September 7.
- The largest bass weighed-in this year was 6.51 lbs, by Matt Baltzer on June 15.
- 419 total fish were weighed-in through the 24 regular season tournaments and the championship in 2010.
- 1,033 lbs of bass crossed the scales in 2010.
- The average number of bass weighed-in per tournament in 2010 was 16.8.
- The average weight brought in per tournament in 2010 was 41.31 lbs.
- The average bass weighed-in this year was 2.46 lbs.
Just when you thought it would be hard to beat the number and quality of fish weighed-in during the 2009 season -- the 2010 season blew away 2009 with 419 bass weighing in at more than 1,000 lbs! On average, 17 fish were weighed-in at each tournament this year as compared to 10 fish last year. We had 6 tournaments this year with 20+ bass weighed-in as compared to 3 times last year. We had 11 tournaments this year with 40+ lbs of fish weighed-in as compared to 3 last year. And in 2 of those tournaments we had over 80 lbs of fish weighed-in. In my opinion, the 2010 season will be the baseline season that we compare the other seasons to for a long time to come. Caesar Creek has to be considered one of the best bass fishing lakes in Ohio.
Below is a graph showing the total number of fish weighed-in and the total weight for each tournament in 2010. The total number of fish weighed-in is plotted as the blue bars and relate to the scale on the left. The total weight is plotted as the blue line and relates to the scale on the right.
|
|
Last Updated on Wednesday, 04 July 2012 12:39 |
|
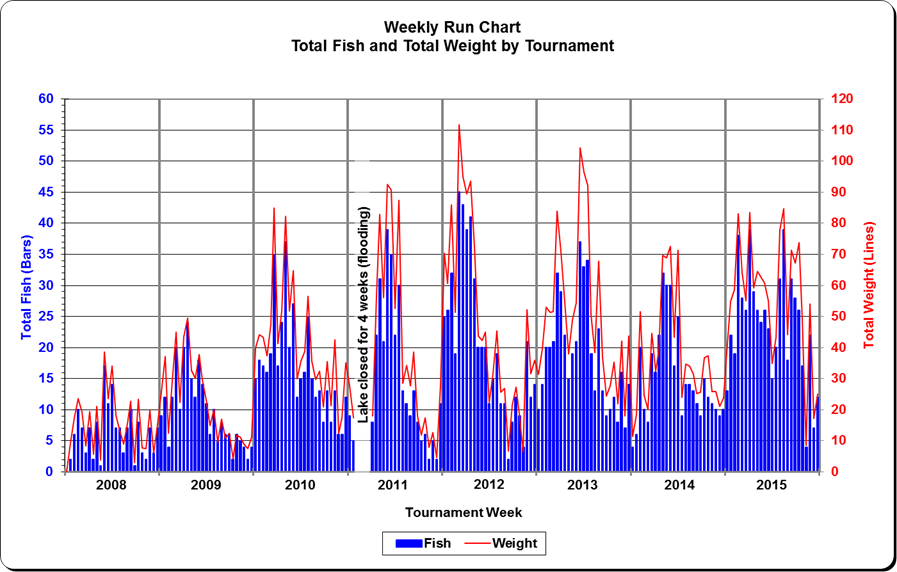
If you are interested in data summarizing the weekly tournament results, check out the following article.
Below is a chart comparing the current year results against previous years for total fish weighed-in and total weight by tournament week. Let me explain what the chart is showing as it has a lot of information packed into a small area. The chart is organized as a series of color coded bars and lines, similar to the Yearly Summary graphs generated at the end of each season. The total number of fish weighed-in for a given week is plotted as a bar and relates to the y-axis scale on the left. The total weight for a given week is plotted as a line and relates to the y-axis scale on the right. A bar and line is plotted with the same color for a given year as indicated in the legend.
|
|
|
|
|
|
|
Page 1 of 2 |